
Watch the webinar and complete the tutorial below to find out what you can learn about the ESKAPE pathogens from their genomes.
Introduction
MORF Genomes is a web-based platform that allows you to explore, compare, and analyse microbial genome sequences without any coding or specialist bioinformatics knowledge. This tutorial walks you through the key features of MORF using the ESKAPE pathogens as an example. The ESKAPE pathogens are six antibiotic-resistant bacteria responsible for the majority of life-threatening hospital-acquired infections worldwide.
By the end of this tutorial you will be able to
- Navigate the ESKAPE Pathogens project in MORF
- Browse individual genome pages and search for specific genes
- Use the Genome Features tool to see what AMR genes are present in the different ESKAPE pathogens
- Interpret ortholog analysis results to compare genomes
- Use what you have learned from MORF to work through the exercises in section 5.
Section 1: Getting started
Accessing public projects in MORF
Go to https://morf-db.org/projects/home you will see All Projects. Click on the ESKAPE Pathogens tile to open the project, or use morf-db.org/projects/MGR00010/MORF000158
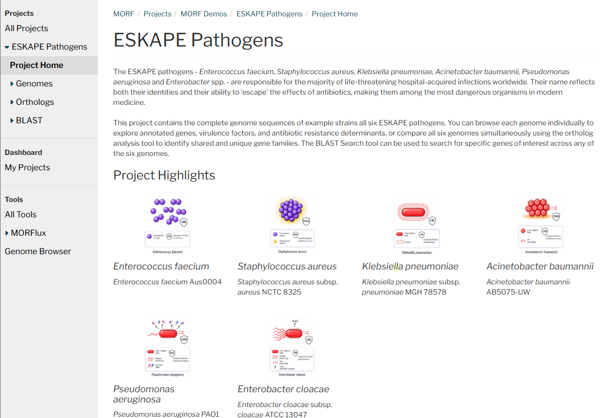
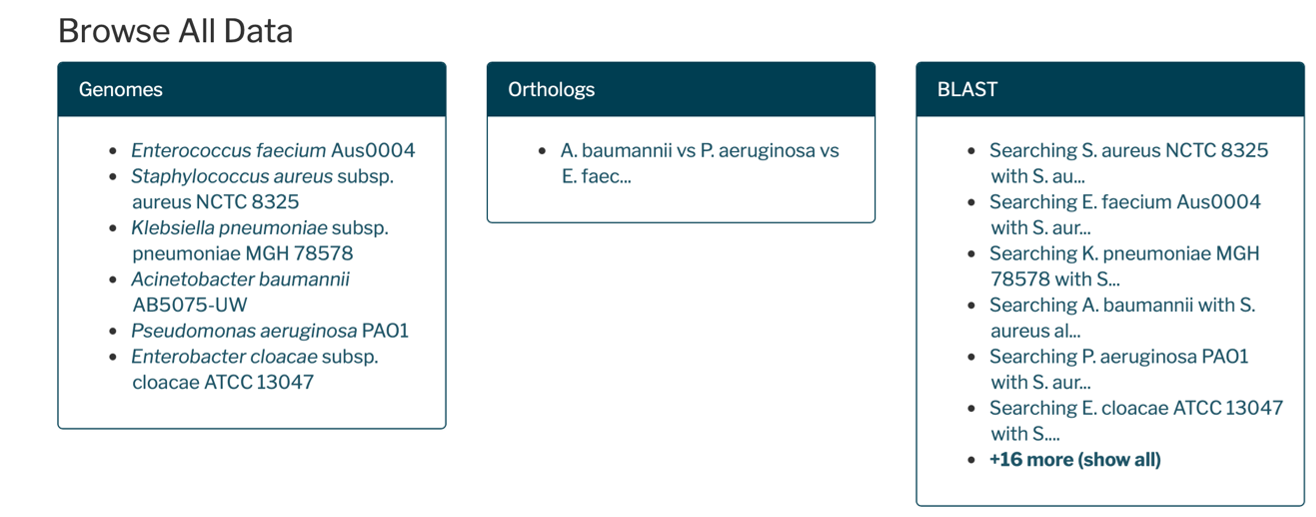
📷Screenshot: The ESKAPE Pathogens project homepage showing the six genome entries and navigation options
Tip: The MORF Demos are publicly available through All Projects at the top of the side bar. You do not need a subscription to browse these projects, which includes all our Public and Demo projects.
Section 2: Browsing Individual Genomes
Navigating to a Genome Page
We’re actively looking to work with researchers, universities and organisations interested in helping shape the next generation of microbial digital twin technology.
For each of the ESKAPE organism, a graphic shows their main features, including their morphology, motility, key antibiotic resistance property and if they are Gram positive or negative. Each pathogen has its own genome page where you can browse all annotated genes, view the circular genome map, and explore individual gene entries.
Step 1 From the ESKAPE Pathogens project homepage, click on any of the six summary images to see a larger view of the features of this bacterium, and on the name below this to link through to the Genome page. For example, click Staphylococcus aureus subsp. aureus NCTC 8325.
Step 2 You will see the genome page showing the circular genome map and a linear view below it. Scroll down to find the Genome Details section showing the accession number, taxonomy, genome size and total feature count.
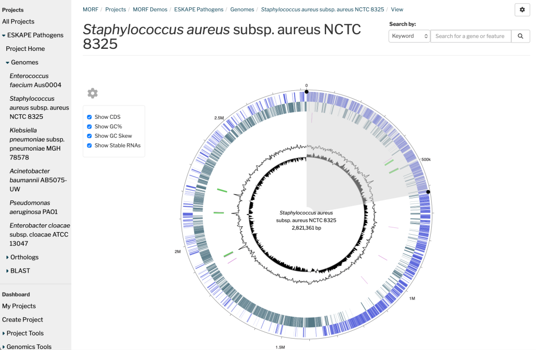
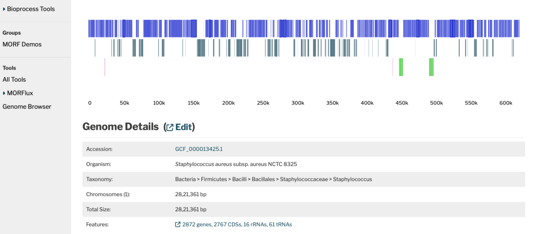
📷Screenshot:The S. aureus genome page showing the circular genome map with search options, and the Genome Details section below showing accession, taxonomy and feature count
What can we learn from viewing the circular Staphylococcus aureus genome?
The genome overview tells you about the starting point of replication, coding regions and any potential acquisition of new DNA that the organism may have gained.
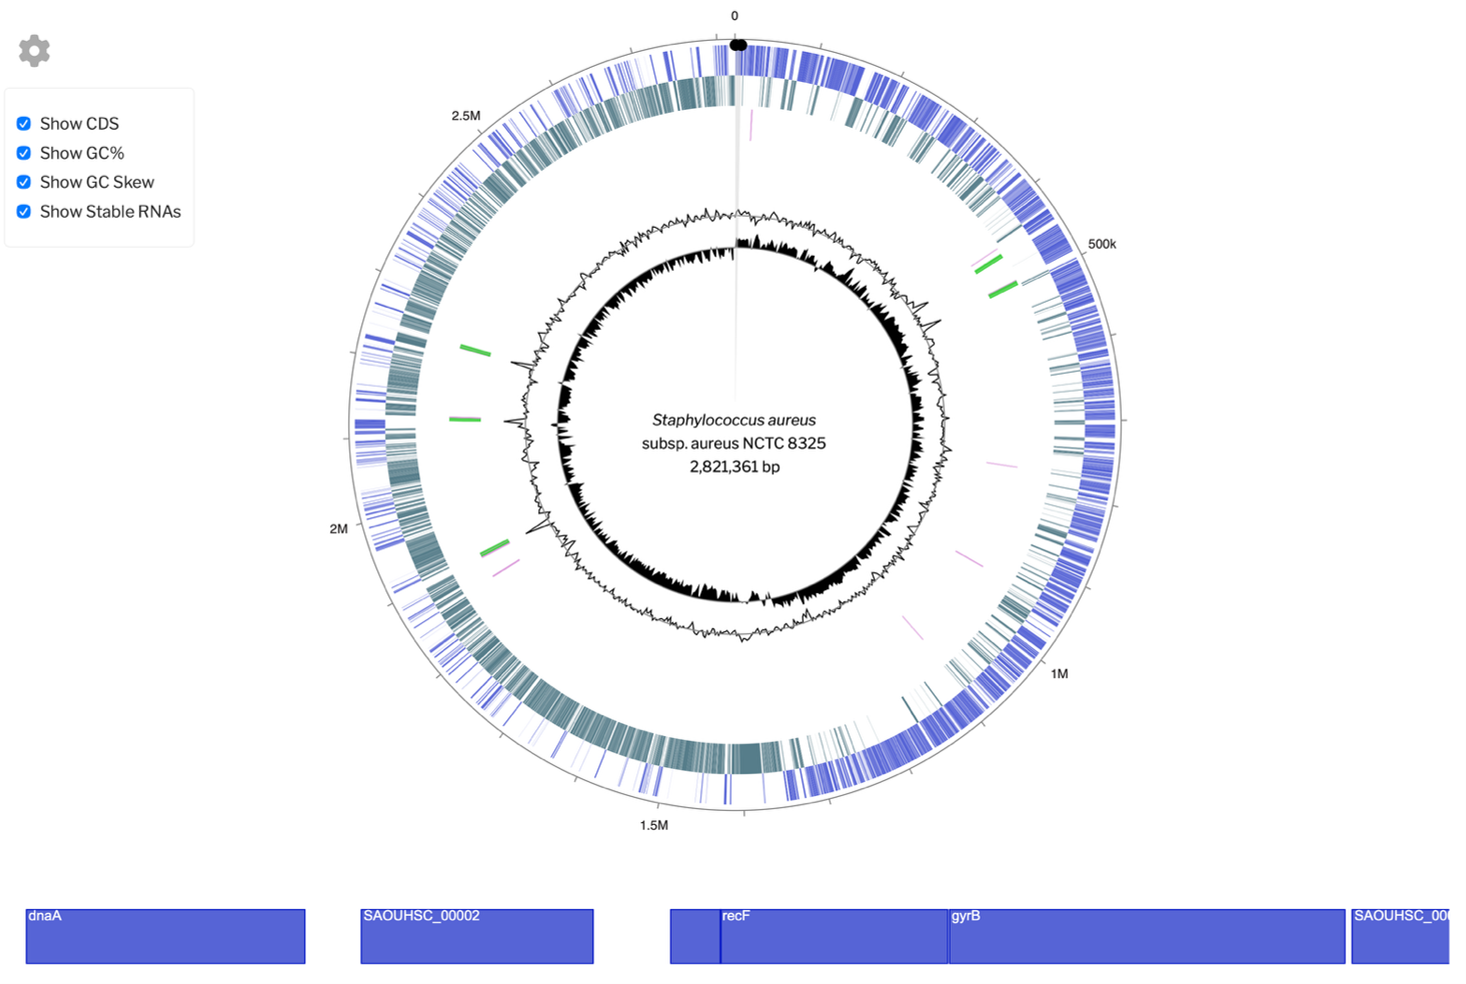
📷 Screenshot: The S. aureus circular genome view. The dnaA gene is normally encoded adjacent to the oriC region that marks the origin of DNA replication and is depicted at the top of the circle. Most genome annotations of bacteria use dnaA to define the ‘start’ of the genome. Any region you have selected in the circular view is displayed in a zoomed linear representation below, from where you can link to individual gene pages.
Step 1 In the overview you can adjust the genes displayed in the zoomed linear view by moving the dots to expand or contract the selected region. Alternatively double click to move the highlight any region you want to look at. Here we have focussed on the starting point of replication which is close to a gene called dnaA.
You will notice that there are two colours in the genome, one represents the genes coded on the forward strand (blue), and those coded on the reverse strand (green). Some bacteria like S. aureus have a very strong strand bias such that the direction of transcription of a gene correlates with the direction of bidirectional DNA replication from the origin to the terminators (about 6 o’clock in the circle).
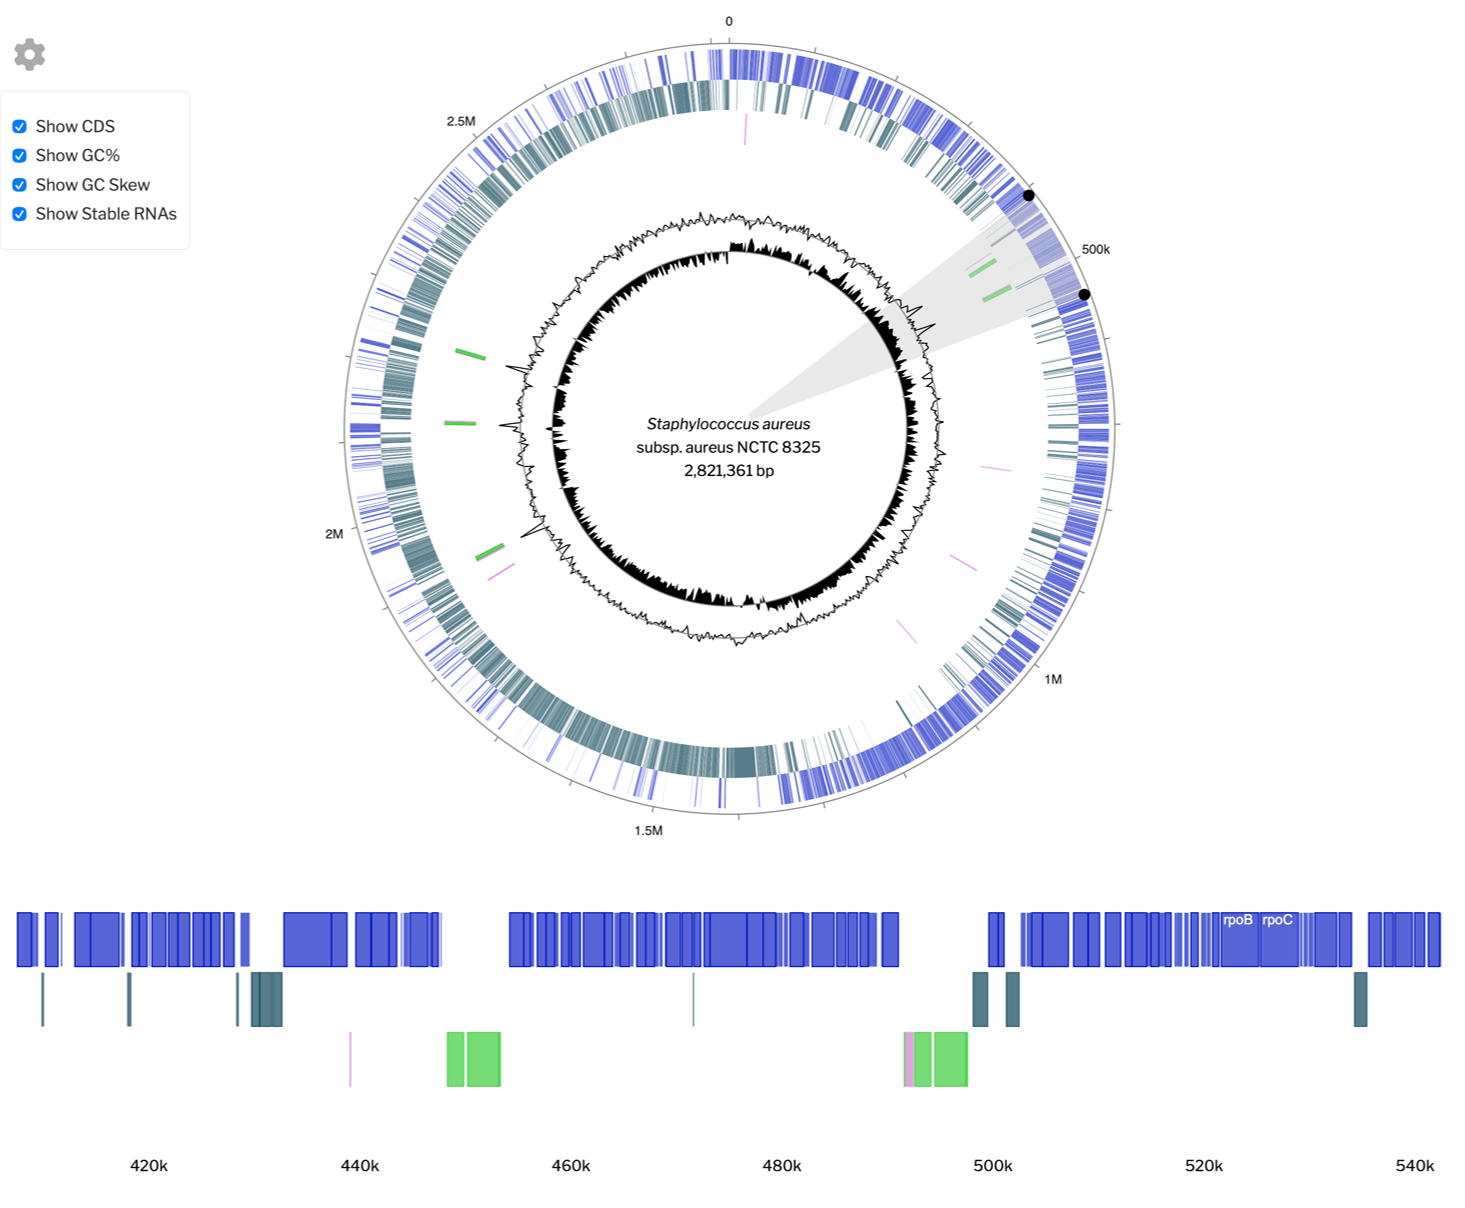
📷 Screenshot: Ribosomal RNAs are depicted in bright green
Step 2 If we change our focus to the stable RNAs highlighted in bright green, which are shown on the next two tracks in the circular view and below the protein coding tracks in the linear view, we can see there are 5 regions encoding the ribosomal RNA (rRNA). Having multiple copies of rRNA encoding genes is common trick bacteria use to ensure that when they are growing quickly they have enough ribosomes to ensure high rates of protein synthesis. Because these regions of the chromosome are transcribed but not translated, their GC content is quite a bit different to the average of the whole chromosome, which you can see clearly by the spikes on the GC% content plot, which is the 5th track in the circular view.
Bacteria chromosomes have evolved over millions of years to have a certain average nucleotide content, which we usually report as the percentage of G and C bases in the DNA. For the model bacterium Escherichia coli this is about 50%, but this can vary quite considerably in other branches of the bacterial tree of life. Hence, if a bacterial genome contains a region with a GC content that is different to the rest of the genome it can tell us that it is ‘new’ DNA that has been recently acquired by the bacterium – a process that bacteria are experts at and which makes movement of antibiotic resistance genes a real problem.
Tip: Toggle the checkboxes on or off to add or remove the genome features.
HGT and antibiotic resistance in Enterococcus faecium
How do bacteria grab hold of DNA from other bacteria? There are several routes they have evolved to do this, which are known collectively as Horizontal Gene Transfer (HGT). In brief there are three main modes of HGT:
Transformation: Where the bacteria can simply take up free DNA from the environment, which it then moves into its own genome.
Transduction: Where a virus (bacteriophage) when escaping from a bacterium it has killed, packages some of that organisms DNA with its own DNA. Hence when it injects its DNA into another bacterium this DNA can sometimes end up integrated with the phage DNA into the chromosome.
Conjugation: Where two closely related bacteria can transfer DNA between them directly by creating a bridge (pili).
While the DNA that is transferred can really be any DNA, and most of the mobilised DNA is not kept, if the DNA encodes an antibiotic resistance gene, it could immediately provide a benefit to the cell and will be kept. So in this case the bacterium hasn’t come up with a new way to resist the antibiotic’s action, it ‘acquires’ a solution from some other bacterium which is already resistant. This mechanism is what we call acquired resistance, which is different in intrinsic resistance that we will look at later. The bottom line is that bacteria are very good at sharing DNA, so that if one evolves resistance to an antibiotic, it is possible that that gene can end up in other more bacteria that cause disease in humans.
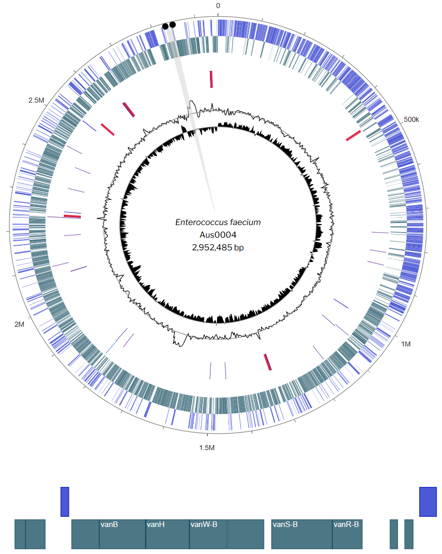
📷 Screenshot The change in GC% indicates where HGT may have occurred
Step 1 If we navigate to the sidebar and click on Enterococcus faecium you will see the gene overview.
Step 2 As with the S. aureus genome, focus on the bump in the GC% at about 11 o’clock, and on the linear zoom you will notice an array of genes all with the prefix ‘van’. These are all involved in Vancomycin resistance. The antibiotic works by stopping the bacteria building a strong cell wall. The cell walls is made from long chains of sugars, but its torsional strength comes by bridging these chains together with cross-links formed by short peptides. The antibiotic stops the peptide cross links from forming so the wall is weak and the cells die. The van genes encode proteins that enable to cell to make a different peptide to link the sugar chains, which is not recognised by the antibiotic. This cunning protection mechanism may have come from a bacterium that makes vancomycin itself (remember most antibiotic we use are naturally made by other bacteria, particular soil bacteria called Streptomyces spp.) and needs to protect itself from being killed. We can see from the location of these genes in region of abnormal GC content that it has been picked up recently by one of the HGT mechanisms and ‘acquired’ an existing resistance mechanism to add to the capabilities of its own genome.
Step 3 E. faecium has another bump in the GC content. If you focus on this area you will see that one of the genes encode for a phage tail protein and those around it bare the hallmarks of this being a bacteriophage that has integrated into the chromosome of the bacteria. We call this a prophage, and in theory this could reactivate at any time, form phage particles and kill the cell. Hence, carrying these prophage is a ‘double edged sword’, they could bring antibiotic resistance genes, or other useful genes with them, but are a capable of killing their ‘host’ at any time. Interestingly if they persist for long enough in the chromosome they will acquire mutants themselves are not be able to reactivate, so are permenatly fixed in the chromosome. We call these cryptic prophage, and sometime it is hard to tell from the sequence alone if a prophage can active or cryptic.
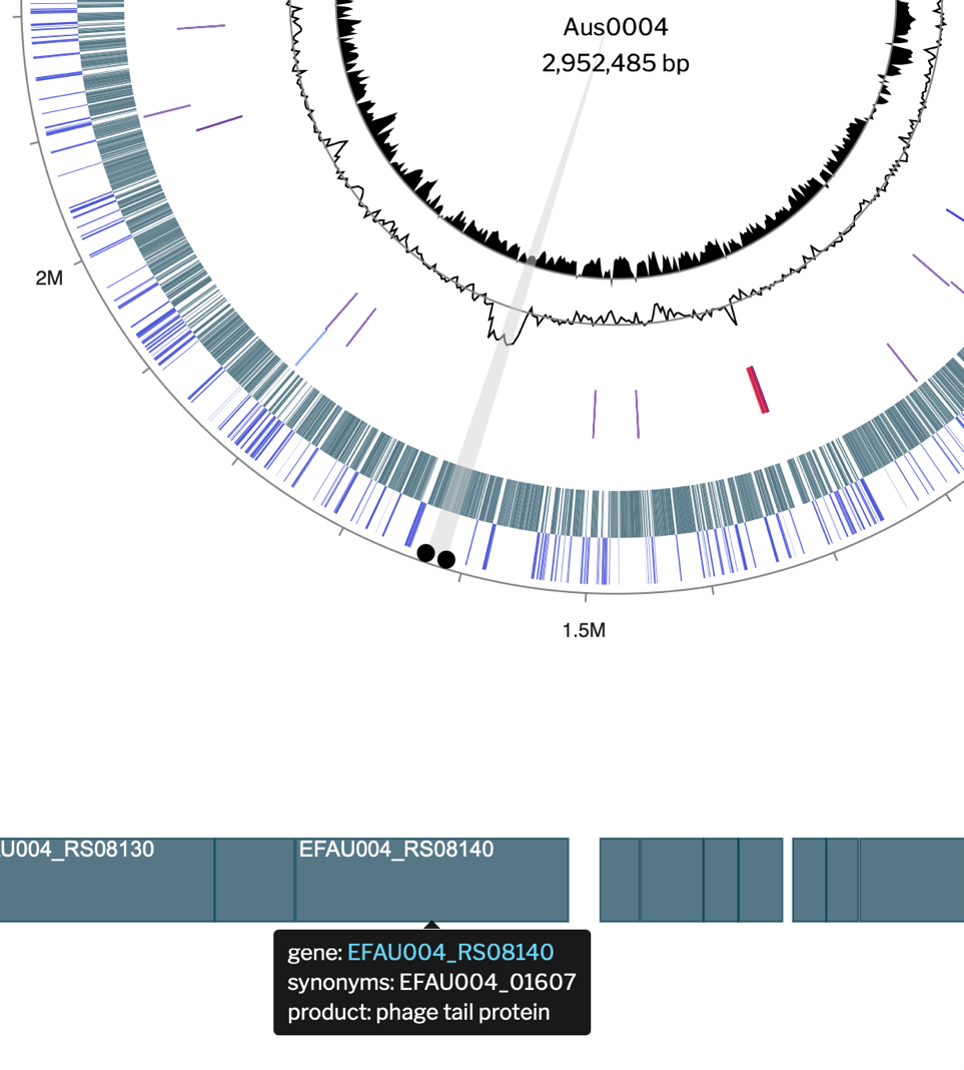
📷 Screenshot Changes in GC% reveal HGT
We have looked at two Gram positive organisms where the focus of HGT has been on the chromosome, lets look at the Gram negatives and mobile genetic elements involved in HGT.
Looking at plasmids in Klebsiella pneumoniae (and Enterobacter cloacae)
If we open up the genome for K. pneumoniae you may notice at the top there are extra icons for the plasmids. These are extra-chromosomal pieces of DNA that are usually circular and can replicate independently from the chromosome. You can click on any of these elements to view the plasmids in the same way as we’ve viewed the chromosome before.
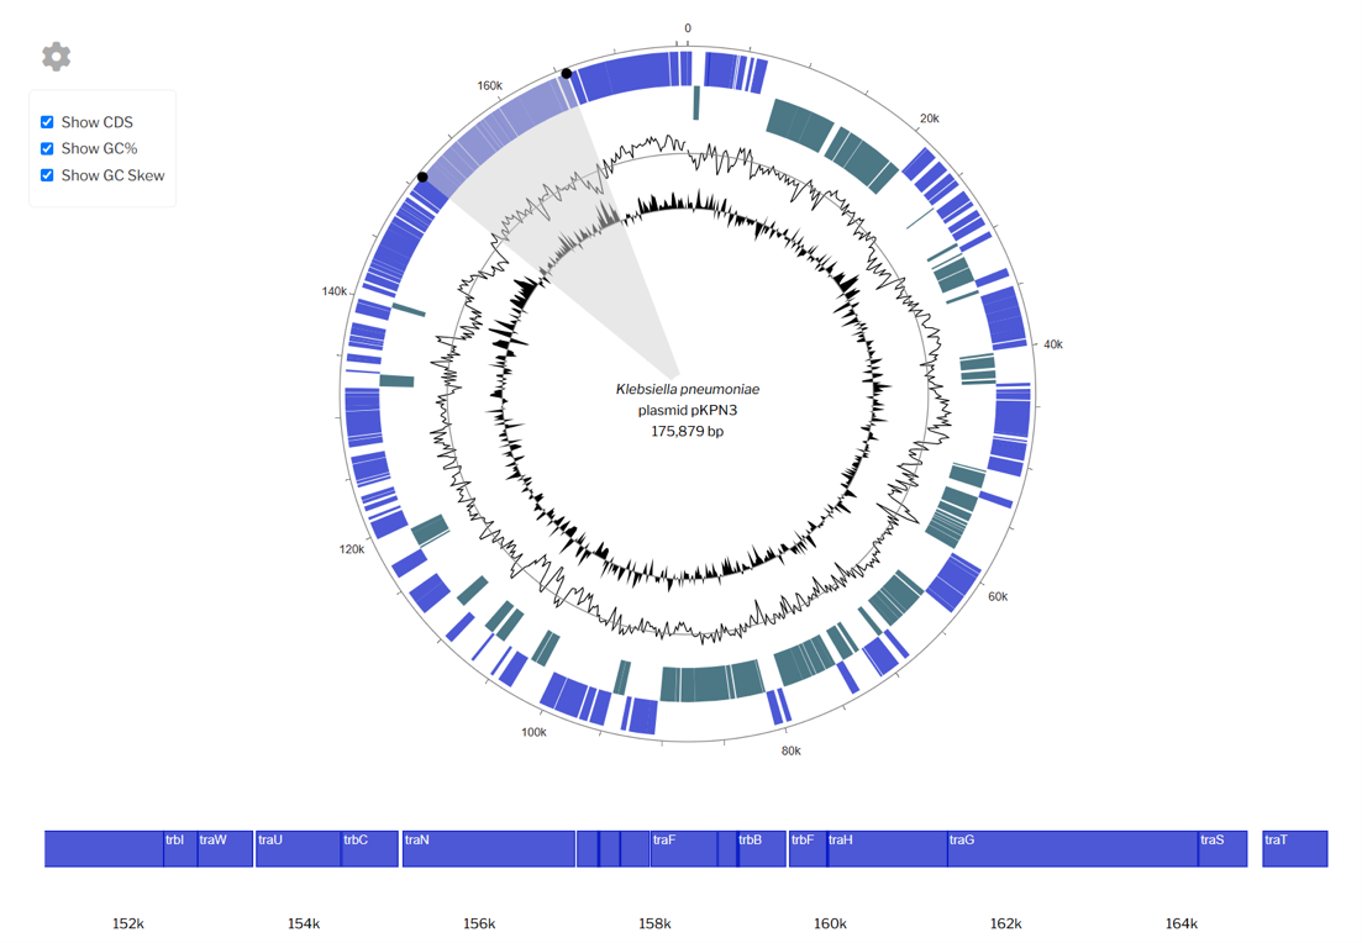
📷 Screenshot One of Klebsiella’s megaplasmids
Step 1 You may notice there are three plasmids, two of which are extremely large. These are classified as megaplasmids. Click on the icon for pKPN3.
Step 2 Highlight the area of the chromosome where there is a large cluster of genes on the forward strand (blue colour). You can see from the rest of the plasmid that this is unusual for there to be such a long string of genes on only one strand. We know that bacteria arrange sets of genes they want to express at the same time in operons, which are on the same strand of the DNA as transcription of all these genes is driven from a single promoter. Hence, long strings of genes on the same strand suggests that these are arranged as operons, which often also suggests they are involved in the same cellular process.
Step 3 If you look at the linear representation of the genes in this big cluster, you will see these are all labelled as ‘tra’ genes. These genes are all involved in the same process and all need to be transcribed at the same time. Together they encode all the complex machinery that allows the plasmid to move from one bacteria to another via conjugation (they were originally named as tra genes, as they were needed for gene transfer from one bacterium to another).
Section 3: Search Genome Features
So we have established that our strain of K. pneumoniae contains a big plasmid, pKPN4, which looks like it can move about by conjugation. What else is encoded on this plasmid? One other quick way to look at this is to browse the features of this megaplasmid using the Browse Genome Features tool.
Step 1 On the genome overview page, scroll down to the Genome details. Click on the ‘Features’ pop-out box. This lists all the gene features present in the genome.
Step 2 Type in the filter results ‘pKPN4’ and expand the rows to 100 rows per page (at the bottom of the list). You should get the table below:
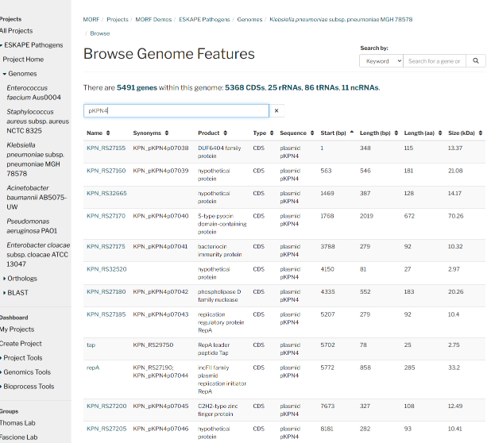
Step 3 You can just browse this gene list by scrolling down and you will soon see a gene encoding a beta-lactamase, which is an enzyme bacteria use to inactivate beta-lactam antibiotics like penicillin. If you scroll further you find other AMR genes like aac and aadA1 gene which allow bacteria to modify aminoglycoside antibiotics to stop them working. Hence, if this plasmid moves around between different strains of K. pneumniae via conjugation, it is also moving AMR genes at the same time.
How many beta-lactamases are encoded in this genome? If you change the filter to look for ‘beta-lactamase’ you will now see there are 5 encoded on the genome, 3 of which are on the pKPN4 megaplasmid. Cripes!
Step 4 Now click on the link for beta lactamase SHV-12. This will take you to the gene page for the gene encoding this protein. As you can see it is named as KPN_RS27220. This naming convention tells you that this specific gene is found in the genome of Klebsiella pneumoniae, in the NCBI database with a unique identifier. If you searched that locus tag in the NCBI database you will find that specific gene.
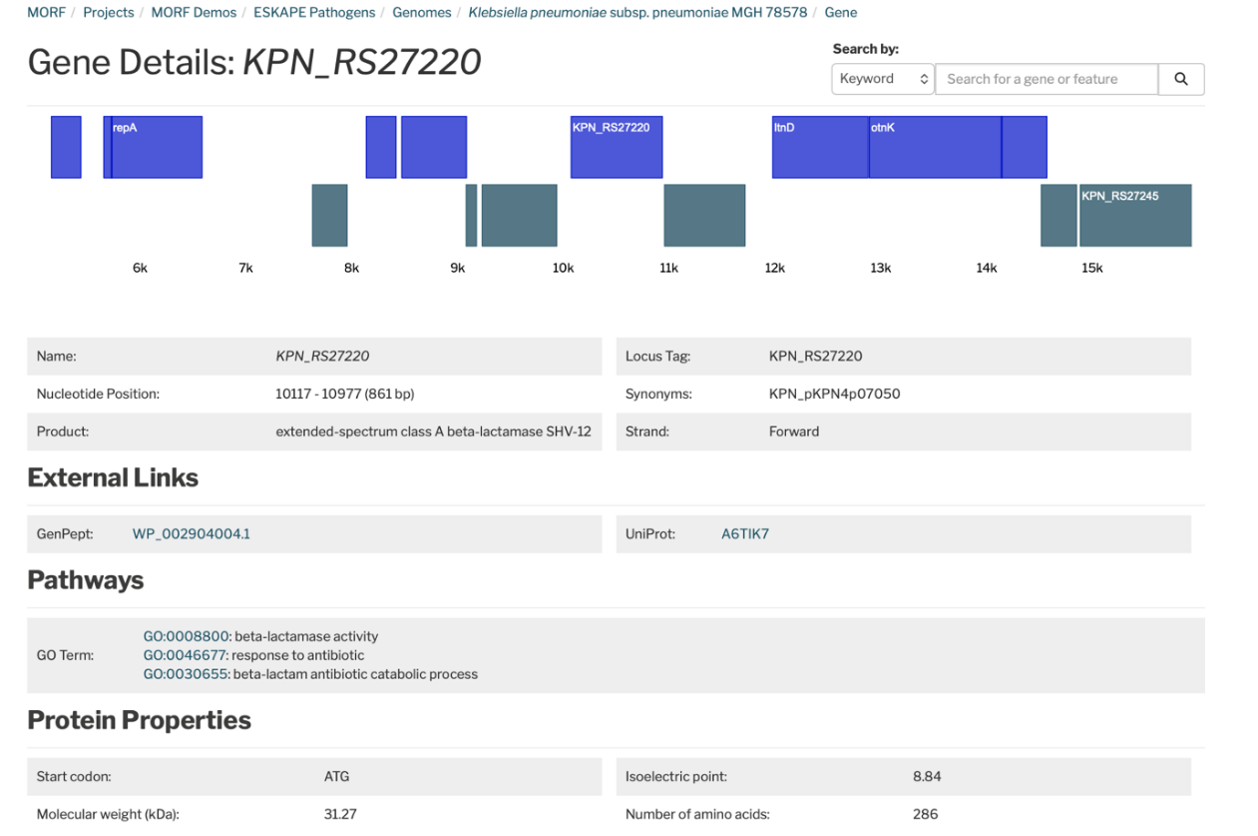
📷 Screenshot The gene page for KPN_RS27220
Reading a Gene Page
Each gene page contains detailed information about that gene including:
- Gene name and product description
- Location on the chromosome (start and end position, length and strand)
- External links to UniProt
- GO term annotations and InterPro family entries
Go Terms
There is a lot of information in this one page. The GO Terms (Gene Ontology) are a standardised naming convention to describe the properties of the resulting protein and describe three types of biological features.
Molecular function: A description of the activity that the synthesised protein will do; in the above example it is beta-lactamase activity. Note: this only describes the function, it doesn’t specify the mode of action or what process it is involved in.
Cellular Component: The bacteria export this protein to the periplasm, which is where beta-lactams antibiotics work, so it needs to be in this place to break them down.
Biological process: This is biological process the protein is involved in, in this case the protein is made in response to an antibiotic, and it specifically breaks down the beta-lactam antibiotic.
Section 4: Ortholog Analysis
What is Ortholog Analysis?
Ortholog analysis compares the genes across multiple genomes simultaneously to identify which are shared and which are unique to individual organisms. MORF uses OrthoFinder v3.1.3 to group genes into orthologous sets of proteins (orthogroups), which means that they are all encoded by the same single gene present in the ancestor of the organism used in the analysis.
There are four categories of orthogroups:
Single copy: One copy in every genome – these are the core essential genes shared by all organisms.
Orthogroup: Present in more than one genome but not necessarily all and may include duplicates (paralogues).
Strain specific: Multiple examples of a orthogroup, but only found in one genome – these are gene families that have expanded in each lineage.
Unassigned: Unique genes encoding proteins with no detectable relationship to any other genome in the comparison.
Viewing the Ortholog Analysis Results for acquired resistance
Step 1 From the ESKAPE Pathogens project homepage click Orthologs in the left sidebar or in ‘Browse all data’.
Step 2 Dropdown gives you Results – click that to get the Ortholog Analysis Results.
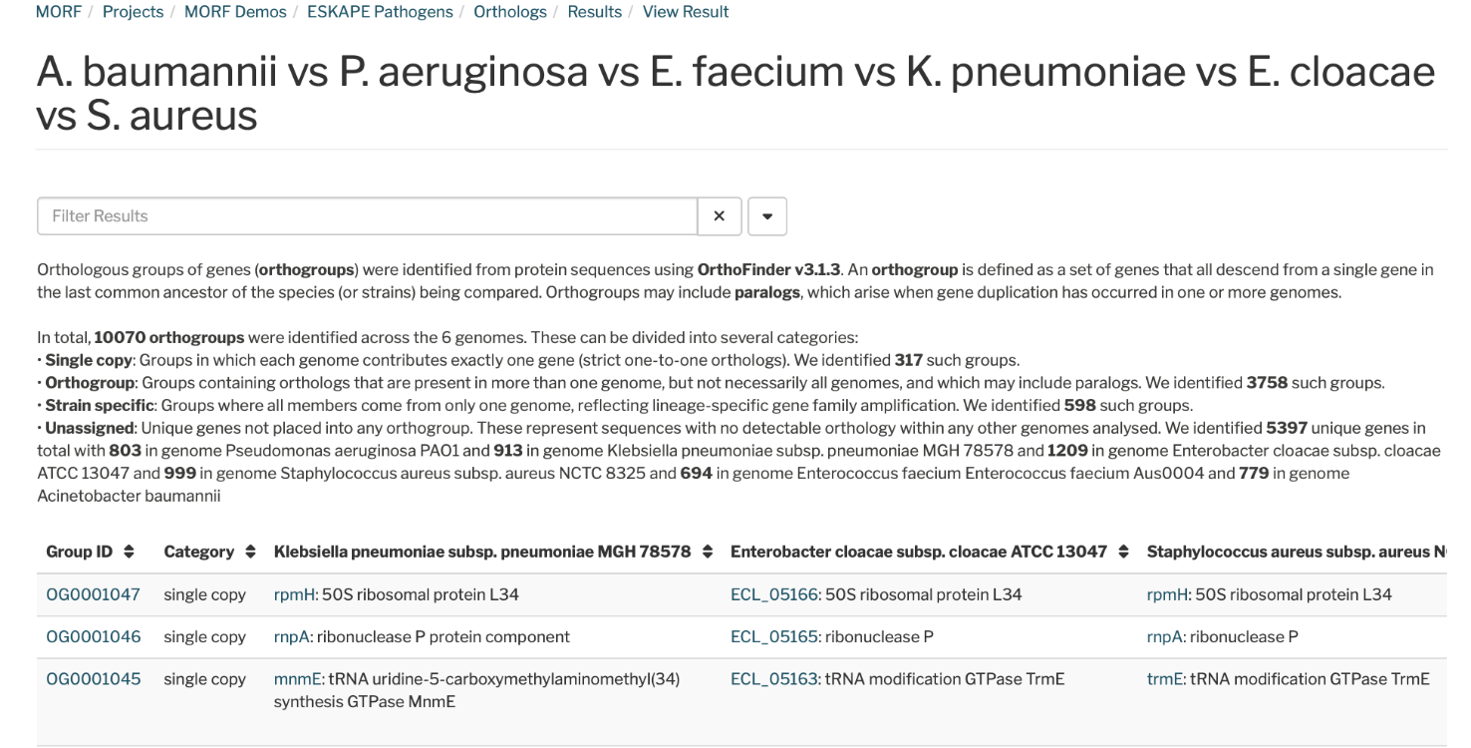
📷 Screenshot The ESKAPE pathogen ortholog analysis
Step 3 The summary at the top shows the key numbers. For the six ESKAPE pathogens: 317 genes are shared as a single copy across all six, while 598 orthogroups are strain specific.
Step 4 Scroll down to browse the full gene table. Each row shows the orthogroup ID, its category, and the corresponding gene in each of the six genomes.
Step 5 As we are interested in AMR genes lets search for a gene that is identical across all 6 species. Broad spectrum antibiotics are aimed at being effective across a wide range of bacteria, so they usually have one specific target. The rpsL gene encodes the S12 subunit of the ribosome and is a known target for binding of the aminoglycoside antibiotic streptomycin.
Step 6 if we type rpsL in the search box we get one hit. Click on the Orthogroup ID (OG0000715).
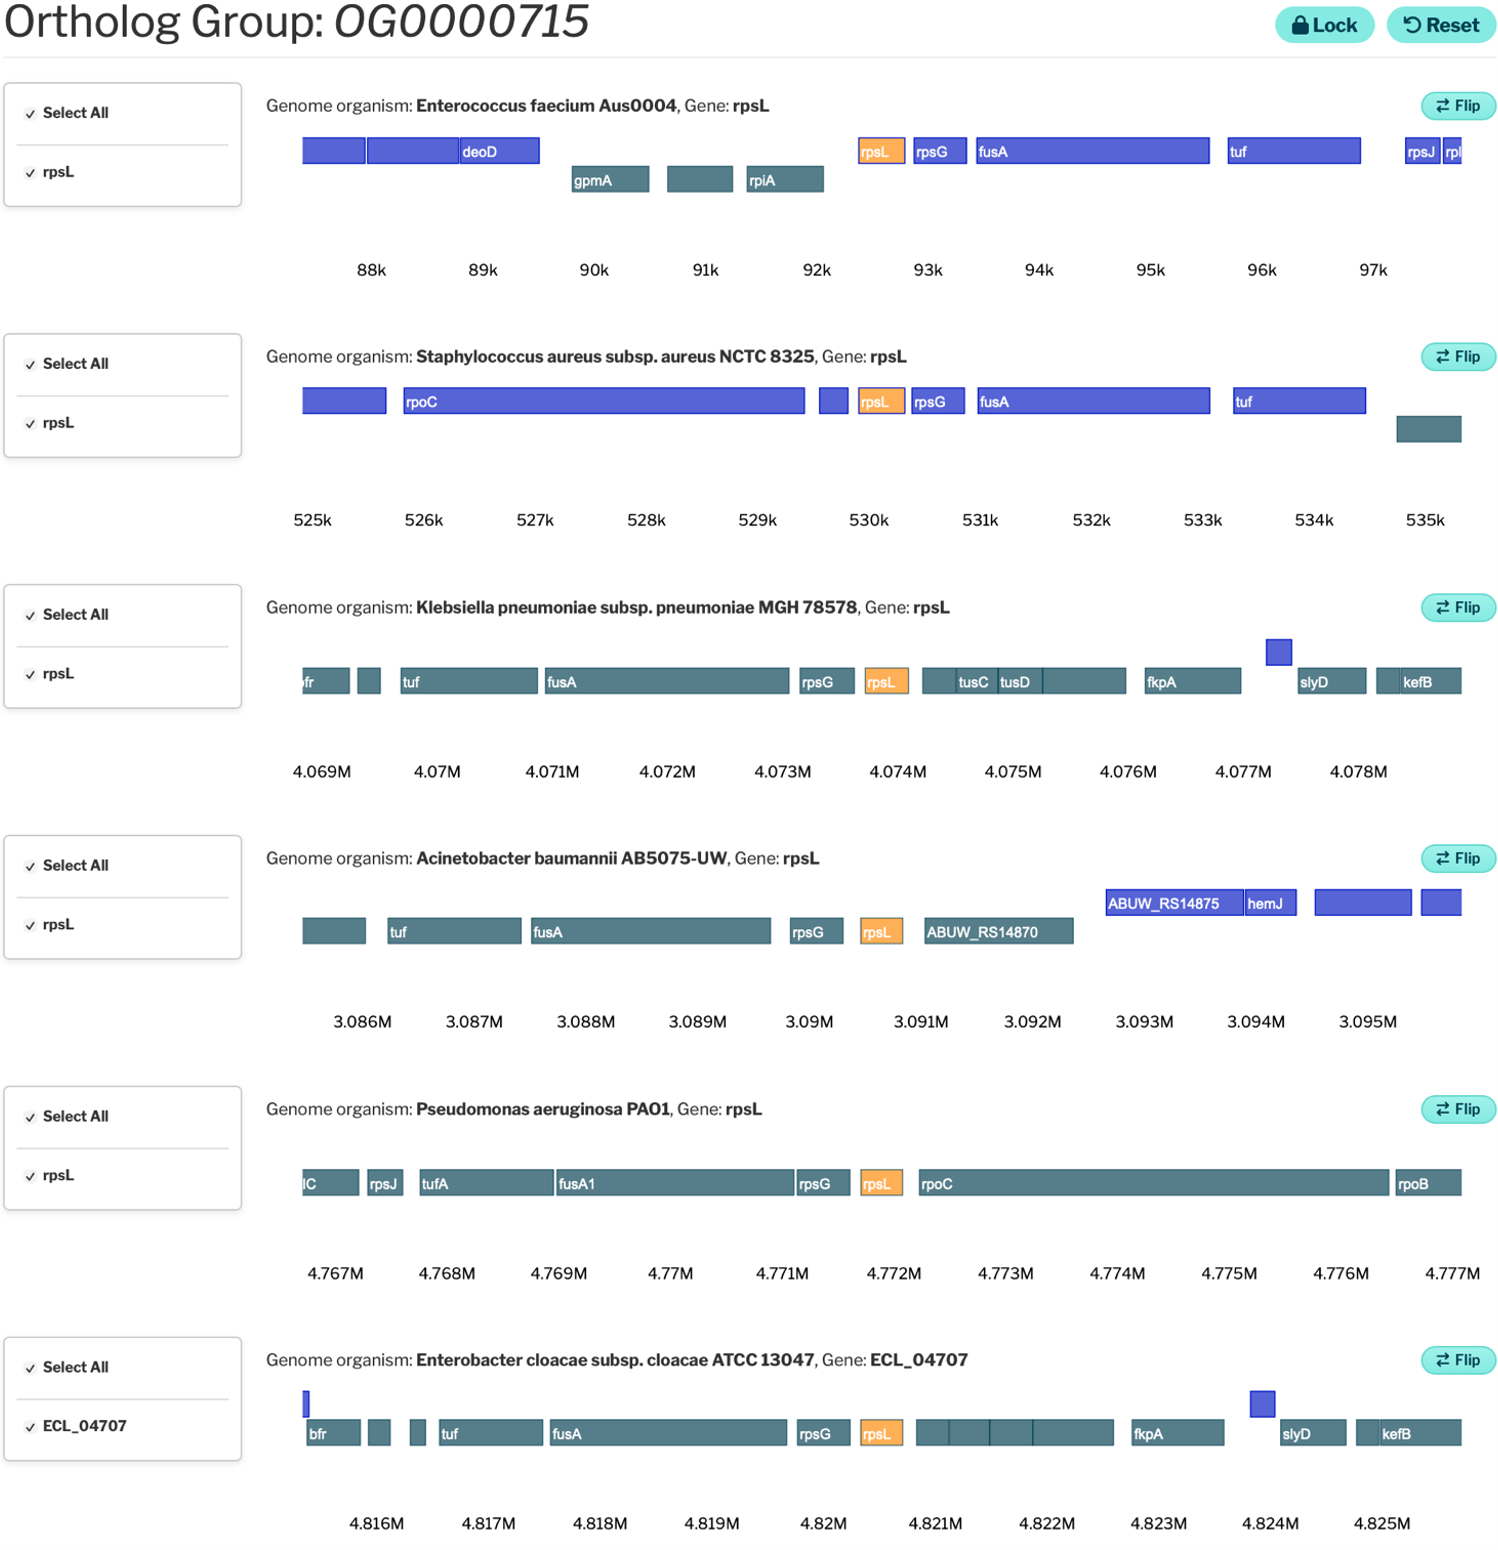
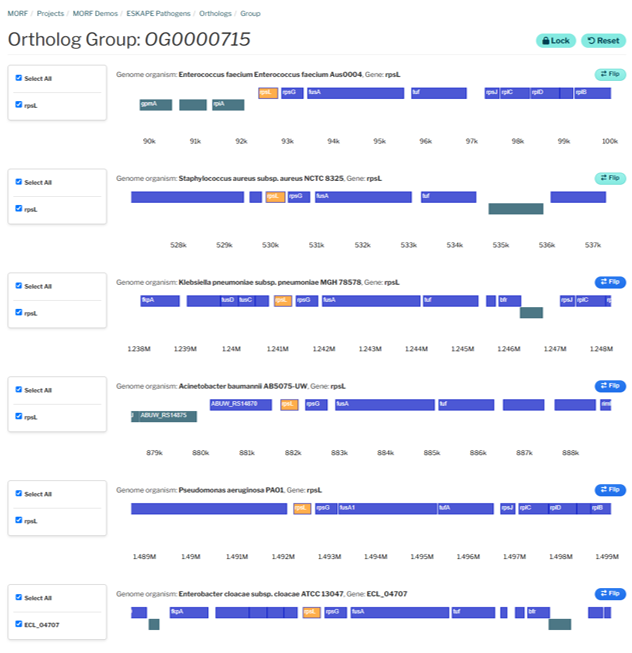
Step 7 You will see that there is an alignment of the genome with the rpsL gene highlighted in yellow. We can see that the two Gram positive bacteria encode the gene on the forward strand, however if you click flip for the Gram negatives, then the genes now align. You may also notice that there are identical genes in the same location (rpsG, fusA and tuf). These are known as superclusters – highly conserved regions that encode genes critical for the cell’s survival.
Ortholog Analysis for intrinsic resistance
We have seen that there are a number of acquired resistance genes from bacteriophage or other mobile genetic elements, now we are going to look at some of the intrinsic resistances in Pseudomonas aeruginosa. While P. aeruginosa does have some acquired resistance genes, it also carries many intrinsic resistances, more than most bacteria.
- aeruginosa intrinsic resistance mechanisms are mainly to do with reducing the rate at which an antibiotic can enter the cell; through narrowing of the channels on the cell surface, as well as having many efflux pumps; actively pushing the antibiotic out of the cell. We would expect to see a large number of these transporter genes within the P. aeruginosa genome compared to the other ESKAPE pathogens.
Step 1 Bring up the Ortholog Analysis Results for the ESKAPE pathogens and type in ‘RND Transporter’ in the Filter Results box. You will see there are 7 orthologous groups listed. If you scroll down you will see apart from one hypothetical protein, there are no genes listed in the Gram positive columns.
Step 2 Type in OG0000065 – you will now see how many more Transporter genes P. aeruginosa has compared to the other bacteria, including other Gram -ve ESKAPE pathogens.
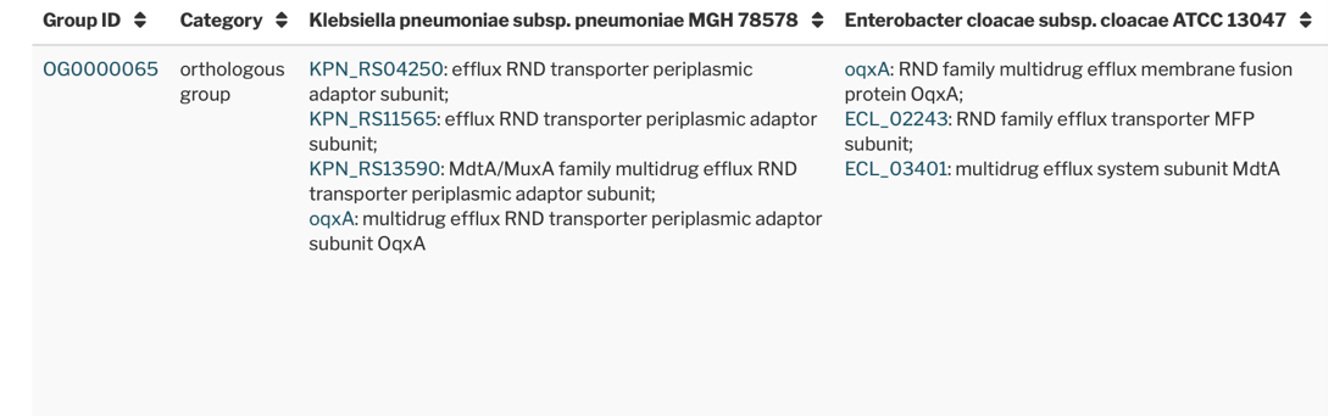
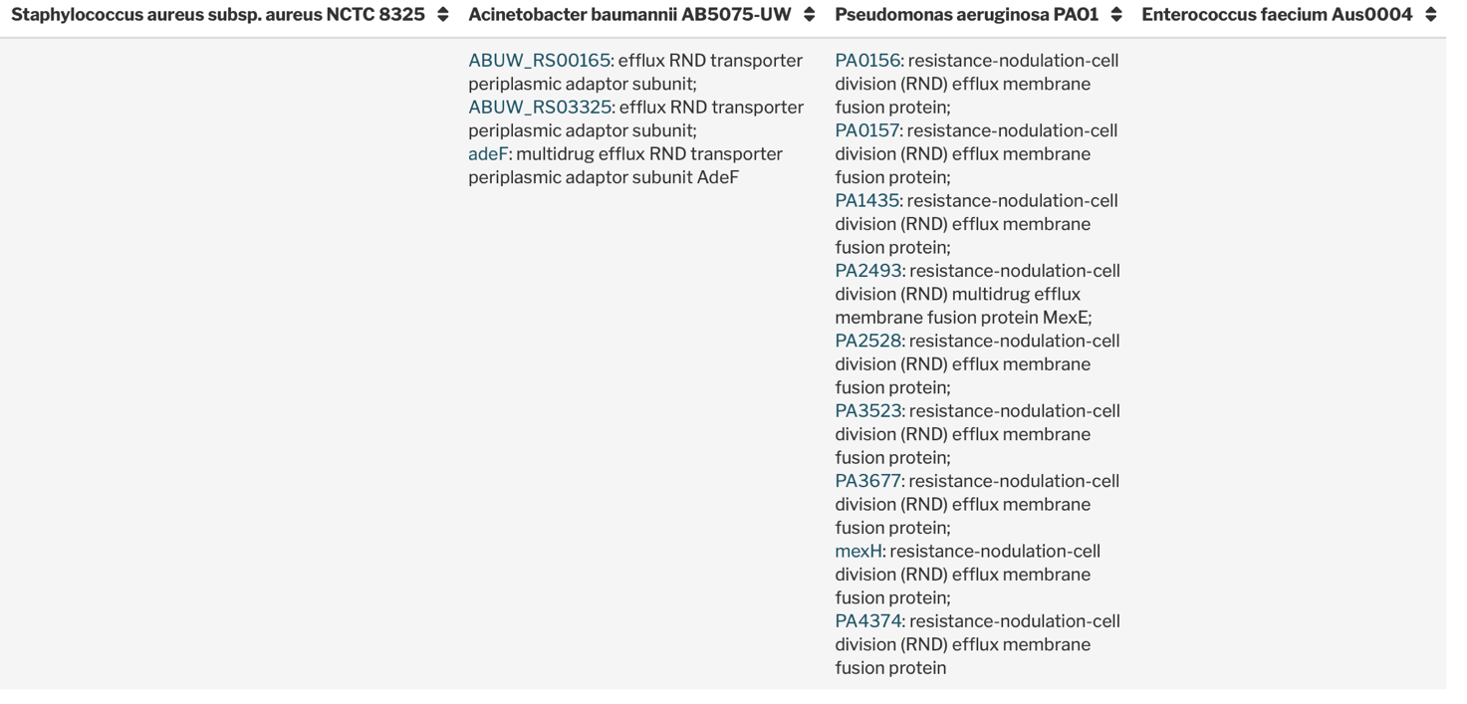
Gram negative bacteria use RND pumps which have an inner and outer membrane and the RND pumps spans both membranes with an inner membrane transporter protein, and periplasmic fusion protein and an outer membrane channel. Gram positive cell walls lack the outer membrane components which are needed for the tripartite structure of most RND pumps, therefore these bacteria cannot form regular RNA systems.
This brings us to the end of our demo. We hope you have enjoyed it and learnt something about these bacteria and how they have evolved resistance to different antibiotics.